


Season Wrap-Up: Diving into the Spurs' team numbers on both ends of the floor
What were the areas where the San Antonio Spurs showed the most improvement this season? Let's dive into that question and more in this breakdown of the team data.

Now that the San Antonio Spurs’ 2023-2024 season is officially over, we can crunch all the numbers and see where San Antonio made some big strides in different areas on the floor this past season.
(1) Significant Improvement
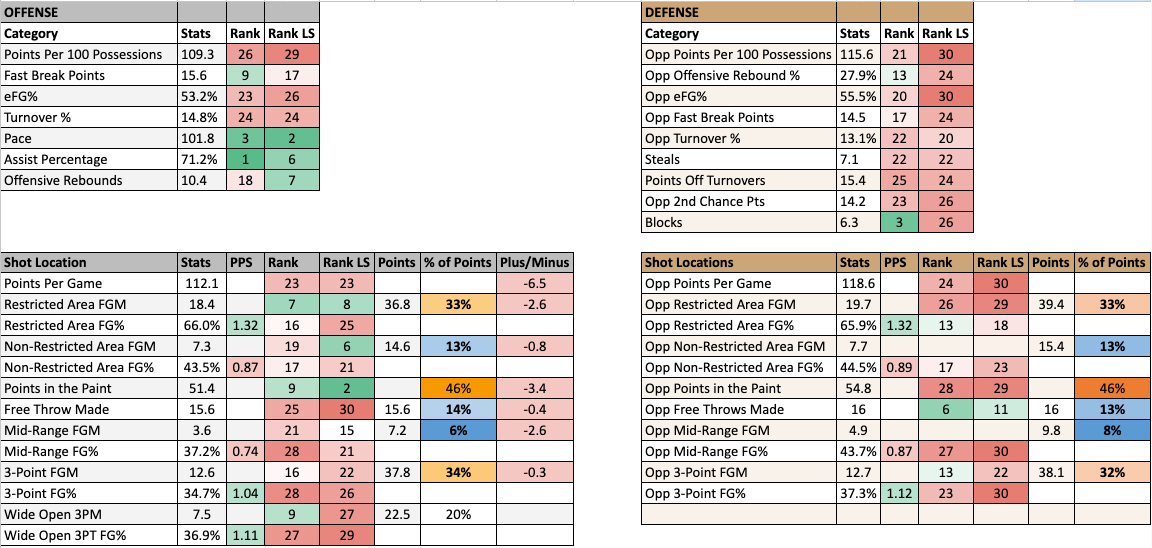
OFFENSE
Fast break scoring - The Spurs scored 15.6 points per game on the break this past season, moving into the Top-10. The team once again played at a Top-5 pace, and whether the opponent made or missed a shot, San Antonio tried to get out on the break.
Taking fewer floaters - This season the Spurs attempted 16.8 floater-range shots per game (11th fewest). Last season San Antonio was taking 21 of those shots per game (3rd most). The floater range shot is one of the most inefficient shots in basketball, so if a team took fewer of those shots, that demonstrates better decision making in shot selection. Victor Wembanyama noted in early March how he was trying to take fewer inefficient shots out on the floor.
Increase in made 3s - The Spurs went from bottom-10 a year ago in made 3s to near league average this season. Accuracy was still an issue for the team and that may be one of the areas of focus the front office addresses this offseason.
Increase in wide open made 3s - With the attention Wembanyama drew on offense, teams sometimes packed his space by sending two to three help defenders on certain possessions. This meant plenty of Spurs players were left wide open. The Spurs increased their amount of wide open made 3s, but as mentioned above, the accuracy will have to improve going into next season so Wemby can have more room to operate.
Opponent offensive rebound percentage - This was another one of those areas where having a 7’6” center out on the floor helped the Spurs improve. The Spurs moved from bottom-10 to slightly better than league average in limiting opponents from getting extra possessions.
DEFENSE
Overall defense - In just one year of adding Victor, the Spurs went from the worst defense in the league to being on the verge of getting out of the bottom-10 at 21st in the rankings. While the overall defense was ranked 21st, the Spurs had the defense equivalency of the Miami Heat (5th) when Wemby was on the floor this season, per CleaningTheGlass.com.
Opponent effective FG% - When you combine shooting from two and three, this was another area where the Spurs showed growth. A year ago, they were dead last in opponent effective field goal percentage. Fast forward to today and they finished 20th in that category.
Blocks per game - With Wemby leading the league in blocks at 3.6 per game, the Spurs instantly went from Bottom-5 in blocks to Top-5 in just one season. No other Spurs player averaged over a block per game.
Opponent made free throws - This has usually been a staple of a Gregg Popovich defense, to limit opponent trips to the free throw line. The Spurs were pretty good at this last season, but this season, they became a Top-10 team in limiting opponent free throw makes. For the amount of times he attempts blocks, Wemby did a good job of not getting in foul trouble, averaging just 2.2 fouls per contest.
(2) Improvement in the Math Game
Now let’s look at the math game, or where the Spurs and their opponents scored on 2s, 3s, and free throws.
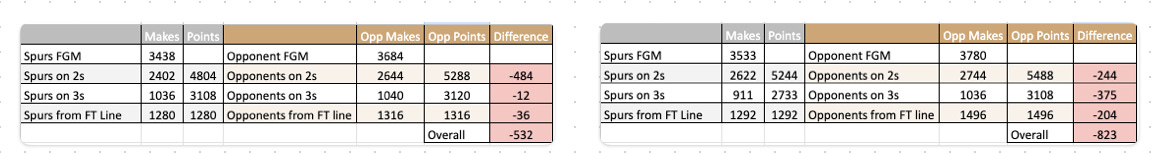
The left side of this table represents the team from this season (23-24), while the right side of the table represents the team from last season (22-23).
When we look at the math game, the Spurs made significant improvements in 3-point and free throw scoring with their opponents, whereas opponents increased their 2-point makes against San Antonio.
Just look at how much the Spurs closed the 3PT gap. Last season opponents won the 3PT line by making 125 more made 3s. This season, the Spurs lost the 3PT line by JUST 4 made three pointers.
The free throw line is also where the Spurs were just 36 made free throws for the season from tying their opponent. Last season that number was a 204 made free throw difference. While the team did struggle more on keeping up with their opponent in 2PT scoring, the total amount of points the Spurs lost by was an improvement by almost 300 points (-823 last season vs -532 this season).
(3) The team was in almost every game post All-Star break
Before the All-Star break, the Spurs were 11-44 with a -8.6 point differential (28th). The Spurs were much more competitive post All-Star break, where they went 11-16 with a -2.1 point differential (22nd).
One illustration that shows just how competitive the team was after the All-Star break is when we look at their quarter-by-quarter offense, defense, and net rating.
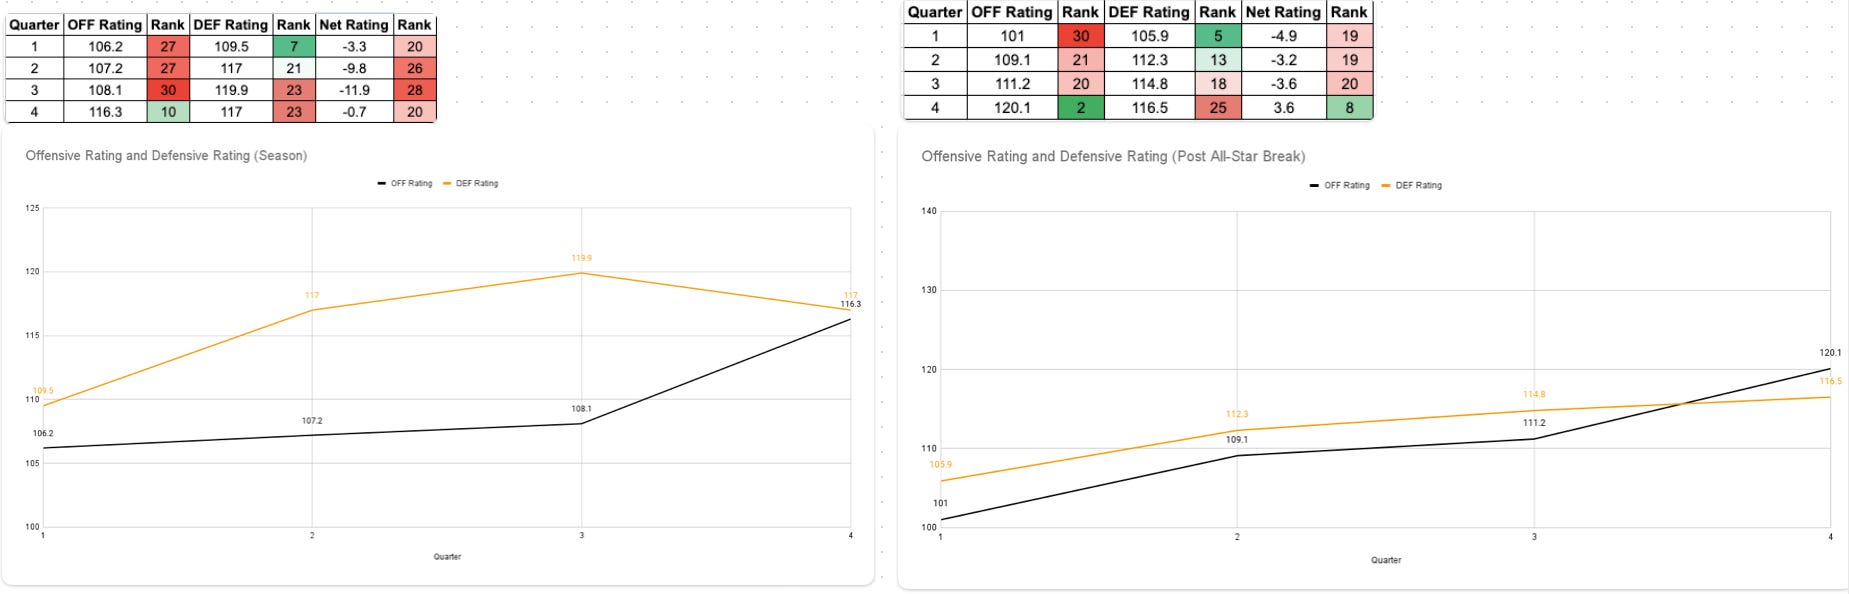
The visual shows the team by quarters for the season (left) and after the All-Star break (right).
Aside from the first and fourth quarter this season, games had been getting away from San Antonio in the second and third quarters.
When we look at the chart on the right, the team was not only much more competitive in the second and third quarters post All-Star break, but they played their best basketball in fourth quarters, winning the quarter by 3.6 points per 100 possessions.
Down the stretch to the end the season, the Spurs picked up some notable wins against teams like Oklahoma City, Indiana, Golden State, Phoenix, New York, New Orleans, and Denver post All-Star break.
Now that the team can see where they finished in year one of adding Wembanyama, they’ll have to decide what approach to take to address the areas of need on the team. While today we looked at areas where the team made improvement from last season, let’s be clear, there is still a lot of improvement on both ends of the floor, after the team was only able to tie their record from last season with 22 wins.